Outlier Detection and Handling
Outliers have more effect on algorithms that use weights (like linear regression, neural networks). Tree-based algorithms are less affected by outliers due to their splitting mechanism.
Handling Outliers
1. Trimming
- Method: Remove outliers completely
- Effect: Data becomes smaller and processing is faster
- Use when: Outliers are clearly errors or noise
2. Capping (Winsorization)
- Method: Replace outliers with cap values instead of removing them
- Process:
- Define a range (min, max)
- Values outside range are replaced with cap values
- Original extreme values are removed
- Use when: You want to keep data size but reduce outlier impact
3. Treat as Missing Values
- Method: Replace outliers with NaN and use missing value imputation
- Use when: Outliers might contain useful information
4. Discretization
- Method: Use binning or binarization to group outliers
- Use when: You want to convert continuous outliers to categories
Outlier Detection Methods
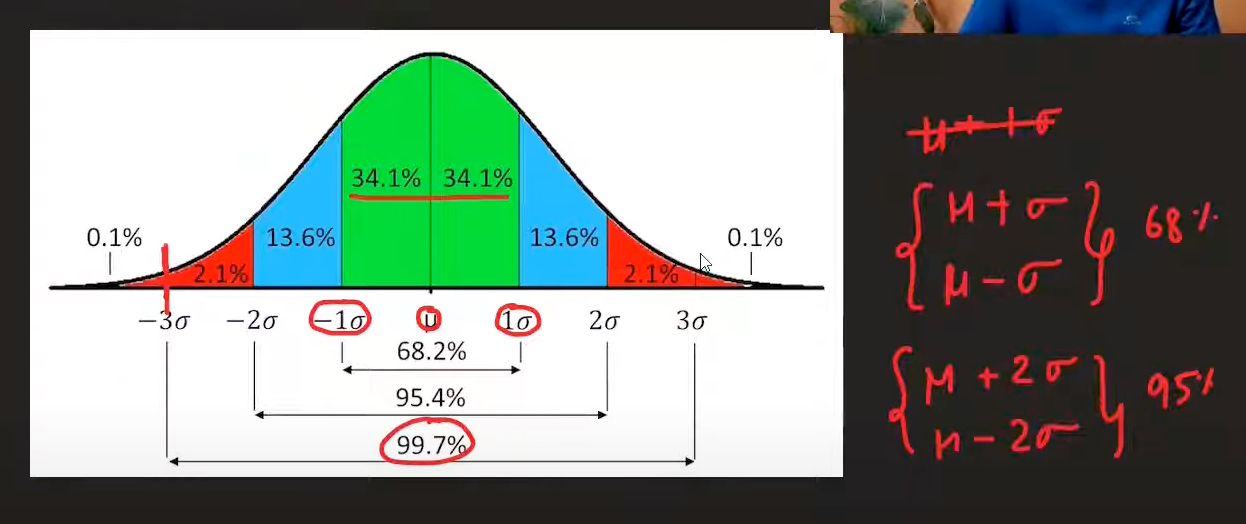
1. Z-Score Method
Formula:
Z = (X_i - μ) / σ
Where:
- X_i = individual data point
- μ = mean of the dataset
- σ = standard deviation of the dataset
Rule:
- If -3 ≤ Z ≤ 3, then it's not an outlier
- If Z < -3 or Z > 3, then it's an outlier
When to use:
- Data is normally distributed
- You want a statistical approach based on standard deviations
Handling outliers:
- Trimming: Remove the outlier completely
- Capping: Replace with the cap value (e.g., 3 or -3)
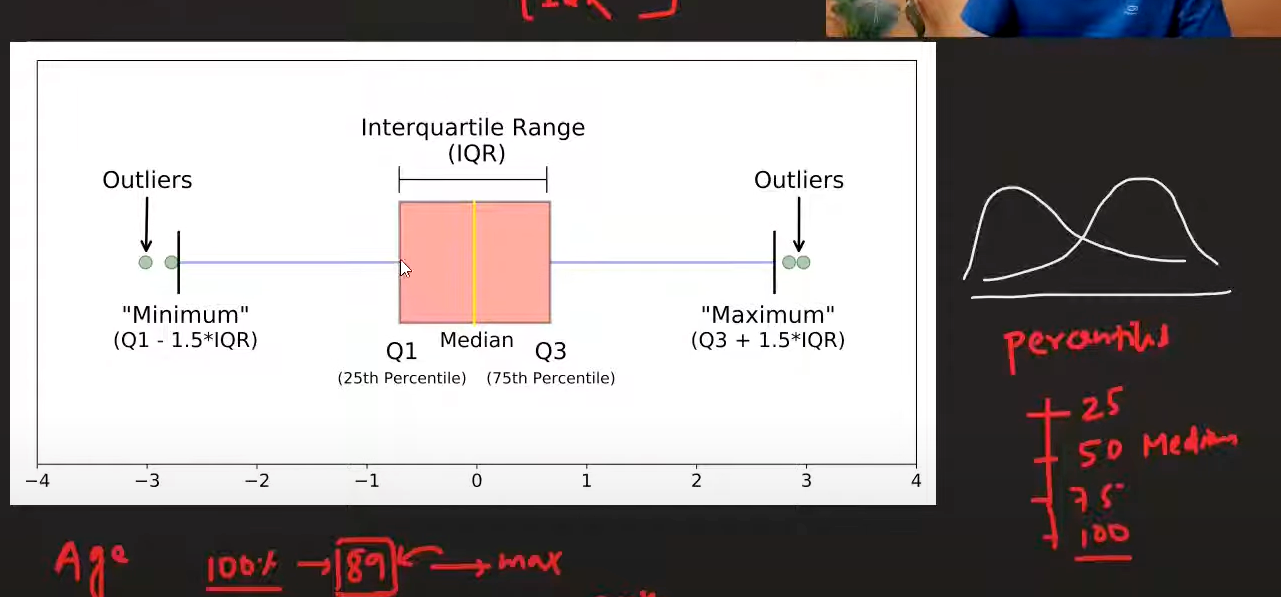
2. Interquartile Range (IQR) Method
Formula:
IQR = Q₃ - Q₁
Outlier boundaries:
- Lower bound: Q₁ - 1.5 × IQR
- Upper bound: Q₃ + 1.5 × IQR
Rule:
- Values below lower bound or above upper bound are outliers
When to use:
- Data is not normally distributed (skewed)
- You want a robust method that's not affected by extreme values
- Data has heavy tails or is non-Gaussian
Advantages:
- Works well with skewed data
- Not affected by extreme outliers
- Standard and interpretable rule
3. Quantile Method
Method:
- Decide a threshold (e.g., 1st and 99th percentiles)
- Values outside the range are considered outliers
Formula:
- Lower threshold: P₁% (1st percentile)
- Upper threshold: P₉₉% (99th percentile)
When to use:
- Data is skewed, heavy-tailed, or non-Gaussian
- You want a robust, distribution-free approach
- You need flexible trimming (e.g., top/bottom 1%)
- Great for cleaning heavy-tailed or skewed data
Capping in Quantile Method:
- When using quantile method for capping, it's called Winsorization
- Replace outliers with the threshold values instead of removing them
Comparison of Methods
| Method | Best For | Pros | Cons |
|---|---|---|---|
| Z-Score | Normal data | Statistical basis, widely understood | Sensitive to outliers, requires normal distribution |
| IQR | Skewed data | Robust, not affected by extremes | May be too conservative |
| Quantile | Any distribution | Flexible, distribution-free | Requires domain knowledge for threshold selection |
Best Practices
1. Understand Your Data
- Check data distribution before choosing method
- Visualize outliers using box plots, scatter plots
- Understand the business context of outliers
2. Choose Appropriate Method
- Normal data: Use Z-score method
- Skewed data: Use IQR or Quantile method
- Unknown distribution: Use Quantile method
3. Consider the Impact
- Trimming: Reduces dataset size, may lose information
- Capping: Preserves dataset size, may introduce bias
- Missing value treatment: Preserves information, requires imputation
4. Validate Results
- Check if outlier removal improves model performance
- Ensure outliers aren't actually important data points
- Document your outlier handling strategy
5. Production Considerations
- Ensure outlier detection works on new data
- Store outlier thresholds for consistency
- Handle new outliers gracefully
Common Pitfalls
- Removing too many outliers: May lose important information
- Not understanding outliers: Some outliers may be legitimate data points
- Using wrong method: Z-score on skewed data may not work well
- Not validating: Always check if outlier removal improves results
- Forgetting production: Ensure method works on new data
Summary
Outlier detection and handling is crucial for building robust machine learning models. The choice of method depends on:
- Data distribution (normal vs. skewed)
- Business context of outliers
- Model requirements
- Production constraints
Always validate your approach and consider the implications for model performance and deployment.